Garment Factory ERP Dashboard: What It Shows and How to Read It
When factory owners ask me what a garment ERP system actually looks like in use, I point them to the dashboard first. Everything else — the scanning, the payment formulas, the inventory ledgers — feeds into what appears on that screen. If the dashboard does not answer the questions a supervisor asks at 10 AM on a Monday, the system will not get used.
The questions a garment factory supervisor needs answered in the first five minutes of their shift are predictable: Are we on target? Where are the bundles piling up? Who is behind? What does today's lot look like? A production dashboard that answers all four without a single manual entry or phone call is the difference between a system that becomes part of the floor and one that sits unused on a server.
This is a walkthrough of each panel in the Scan ERP garment factory dashboard — what it shows, where the data comes from, and what decision it is designed to drive.
The Admin Dashboard: Factory-Wide Summary
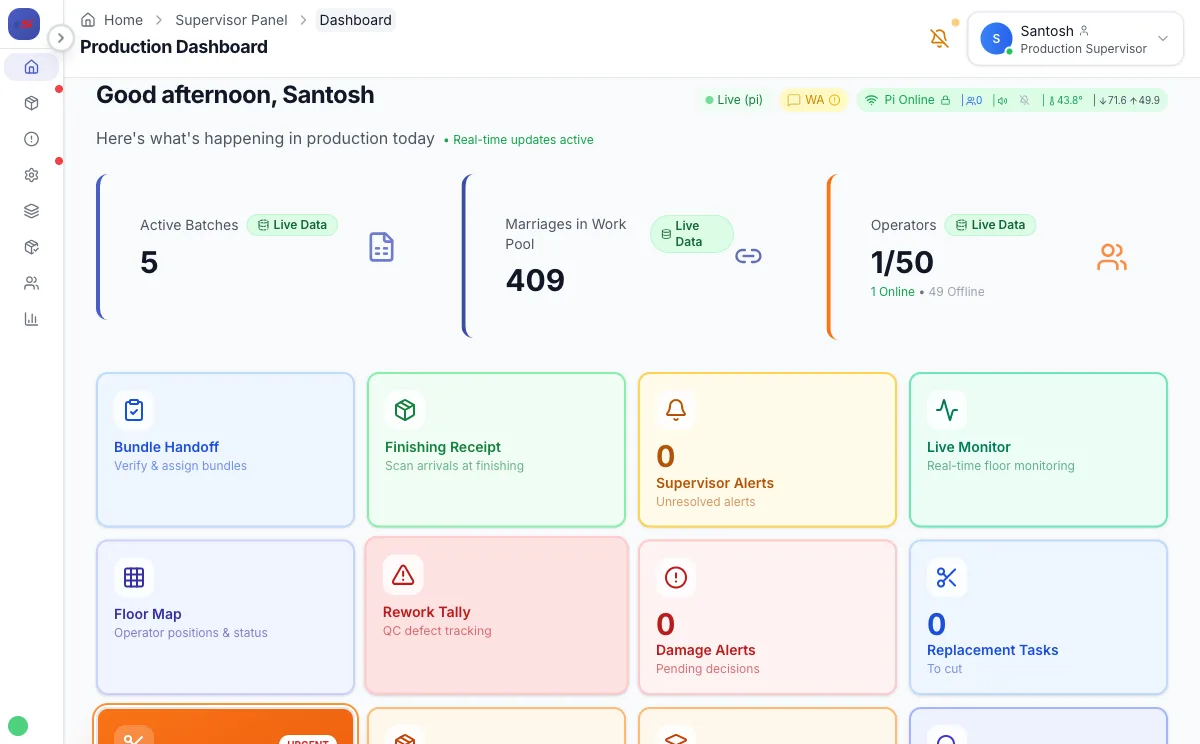
The top of the admin dashboard shows four numbers that answer "how is the factory doing right now?" without requiring the owner or admin to ask anyone:
- Total active operators today — pulled from biometric clock-in data, not a register. If 140 clocked in out of 160, you see that before the morning briefing.
- Pieces completed today (all lines combined) — sum of all completed work pool entries from the first scan of the shift.
- Active lots on floor — how many cutting batches are currently in production. Three active lots usually means three different styles running simultaneously, each with its own deadline.
- Pending alerts — stuck operations, missing payments, scan errors. If this number is not zero, something needs attention.
Below the summary cards, a lot-progress table shows each active style: style number, buyer, total bundles, bundles completed, percent done, and target ship date. The percent column turns amber when a lot is running behind pace and red when it has crossed the point where on-time delivery requires overtime. This is the number that drives every resource allocation decision for the rest of the day.
The Live Production Monitor: What the Floor TV Shows
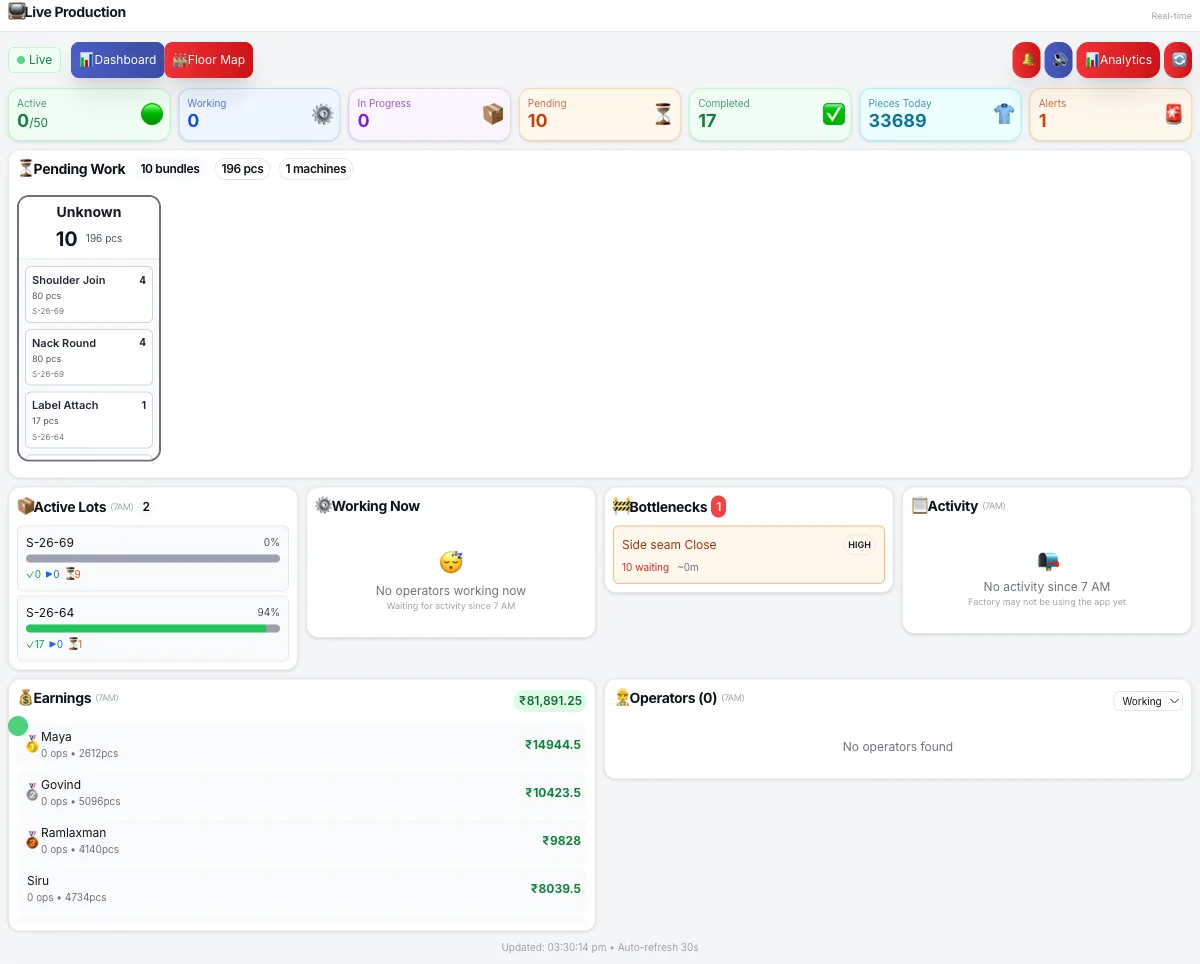
The live production monitor is the most visible part of the system. We run it on a 43-inch Android TV mounted at the end of the sewing line, visible from every workstation. It updates every 30 seconds from the QR scan stream — no manual refresh, no supervisor input.
The production TV shows:
| Panel | What It Displays | Update Frequency |
|---|---|---|
| Line output bar | Pieces completed vs. daily target, as a progress bar per line | Every scan |
| WIP by operation | Bundle count sitting at each sewing station right now | Every scan |
| Bottleneck indicator | Station turns amber when WIP exceeds 2× buffer; red when a bundle has been idle 15+ min | Continuous |
| Top operators today | Leaderboard of pieces completed, updated live | Every scan |
| Current lot ticker | Style, color, size distribution running on this line right now | Per lot change |
The behavioral effect of a public leaderboard is real and immediate. When operators can see their own count displayed alongside colleagues, output increases without any management intervention. This is consistent with what research on piece-rate incentives (ScienceDirect) documents: transparency in output measurement is itself a productivity driver, separate from the financial incentive. In our factory, average daily output per operator increased within the first week of putting the TV on the floor.
WIP bottleneck logic: A station turns amber when the bundle count exceeds 2× the target buffer for that operation's SAM. It turns red when a specific bundle has been sitting at that station for more than 15 minutes without a scan. Red means someone needs to physically walk to that station in the next 5 minutes. Amber means watch it.
The Cutting Batches Panel
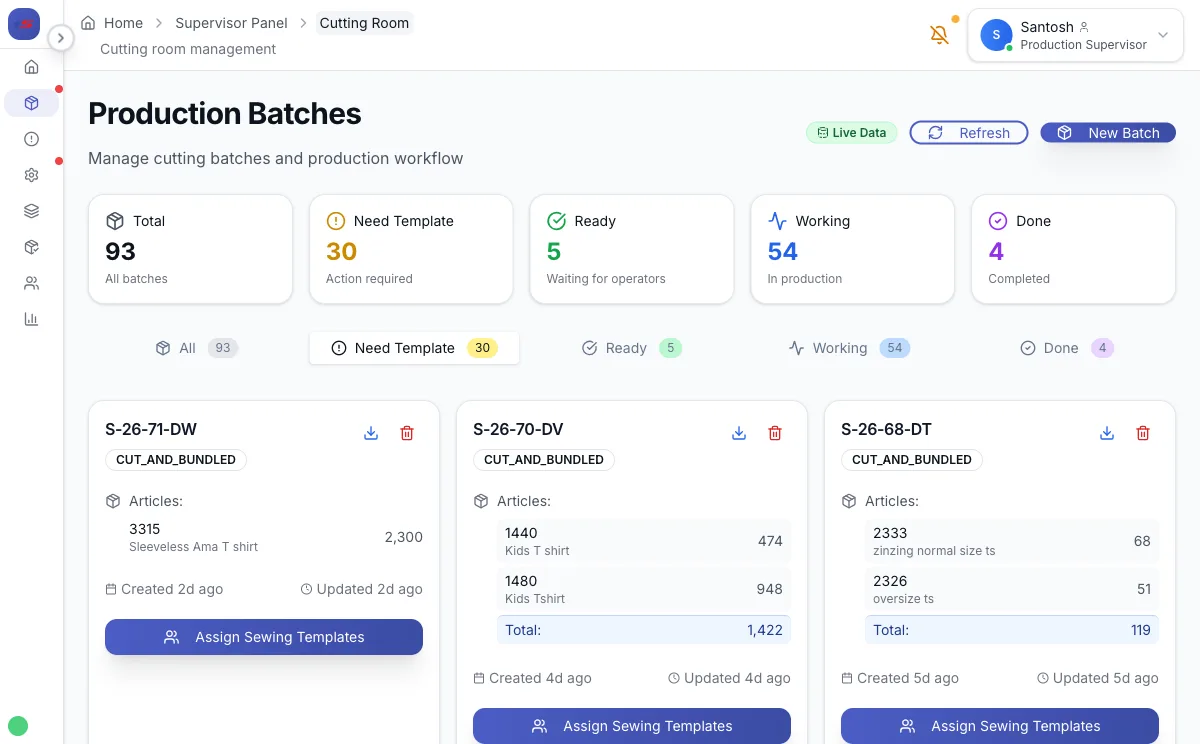
Every garment lot starts in the cutting room and flows from there to the sewing floor. The cutting batches panel is the bridge between those two worlds. It shows every active lot with:
- Lot number and article — which style and buyer
- Size-color breakdown — how many pieces per size/color combination were cut
- Bundle count by status — how many bundles are PENDING, IN_PRODUCTION, or COMPLETED
- Cutting batch status — DRAFT → CUTTING_ROOM → CUT_AND_BUNDLED → IN_PRODUCTION → COMPLETED
The supervisor approves a cutting batch from this panel, which triggers QR label printing and makes the bundles available for work assignment. From that point forward, every bundle is traceable from the cutting table to the finishing rack. If a buyer asks "where is lot S27 right now?", the answer is one click, not a 20-minute floor walk.
The Payment Dashboard
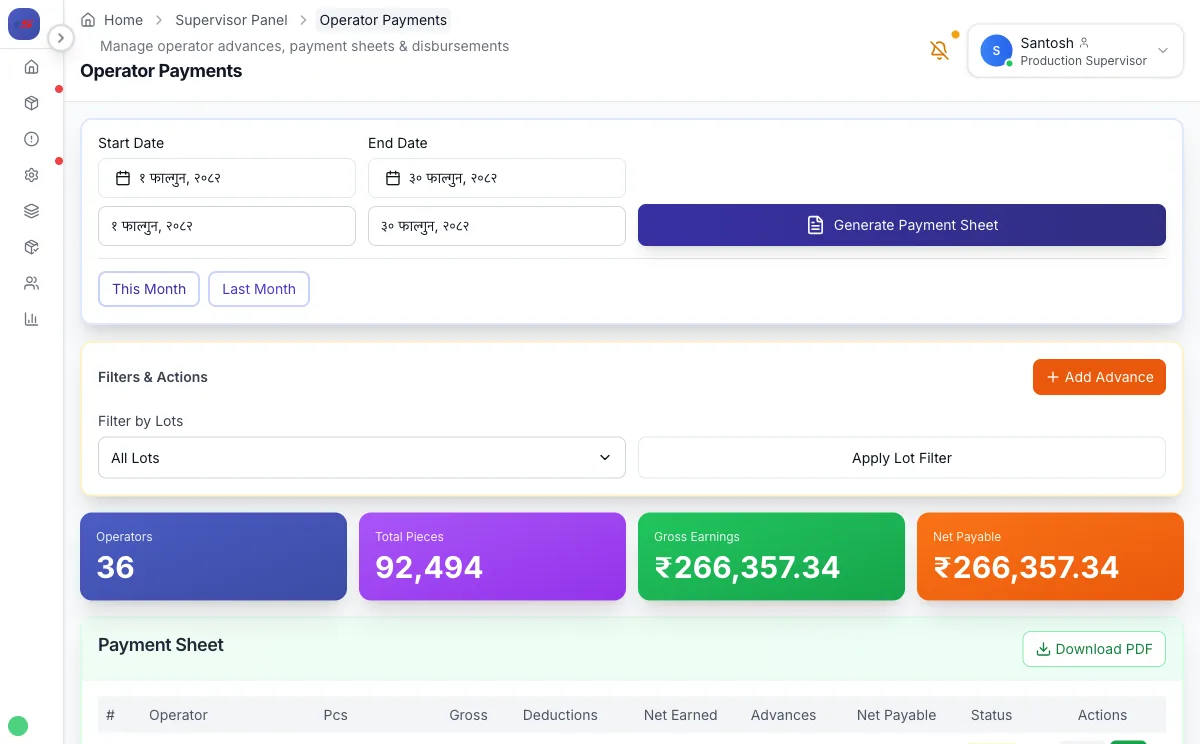
The payment dashboard replaces the accountant's Excel sheet. Every row is one operator for the current pay period. Columns show:
- Pieces completed — from QR scan records, not tally marks
- Base earnings — pieces × adjusted rate (base rate × skill multiplier)
- Machine complexity bonus — automatically applied based on which machine type each operation was completed on
- Quality bonus / penalty — from QC inspection scores linked to the operator's work
- Speed bonus — for operators exceeding target pieces-per-hour threshold
- Overtime — calculated from biometric clock-out time vs. the 8-hour threshold
- Deductions — absences, advances, canteen
- Net payment
The supervisor reviews and approves. No calculation happens at approval time — everything was already computed from the scan and attendance data throughout the month. The approval is just a check. In the three factories running this system, payroll that took 2–3 days in Excel now takes under an hour. Disputes dropped from 15–20 per pay period to 1–2.
Operators access their own row through a personal dashboard on their operator device. They can see their earnings today, this week, and this month — updated after every scan. For the full piece-rate payment formula including skill multipliers and machine bonuses, see our dedicated guide.
The Inventory Dashboard
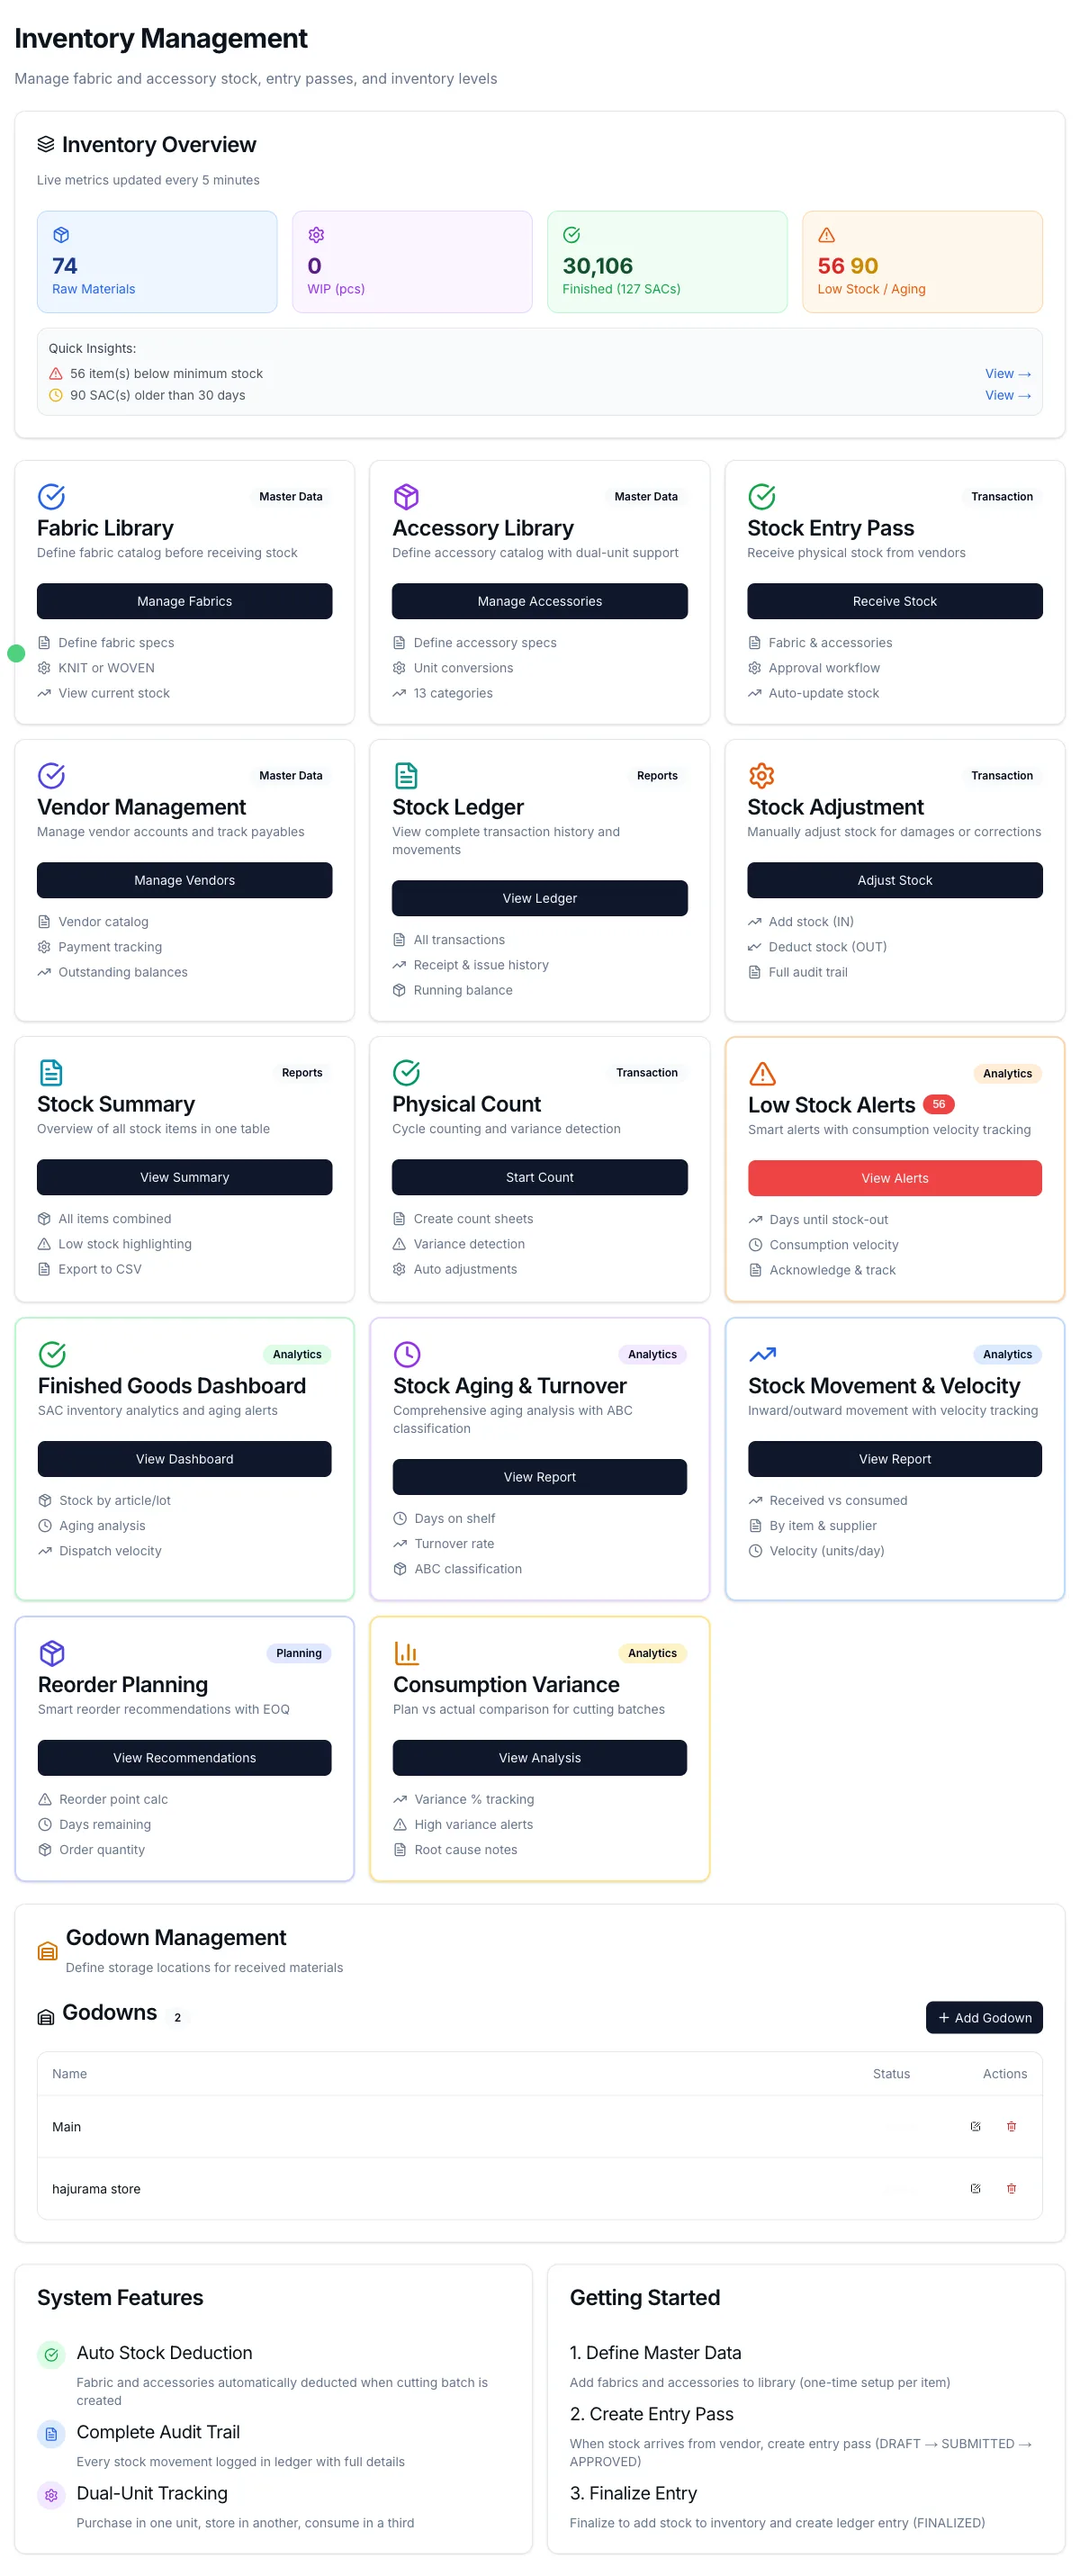
The inventory dashboard covers fabric stock and accessories. For a CMT factory, fabric is owned by the buyer, but the factory is responsible for fabric control — recording how much was received, how much was cut, and reconciling any variance. A fabric ledger discrepancy found after cutting is almost impossible to resolve; found during receiving, it takes 10 minutes.
The inventory panel shows:
- Fabric stock by article, color, and GSM — current balance in meters, last receipt date, and receiving vendor
- Consumption per lot — how much fabric each cutting batch consumed vs. the planned consumption based on marker efficiency
- Accessory stock — buttons, zippers, thread, labels — with minimum stock alerts
- Dispatch summary — finished goods dispatched via challan, with buyer, SAC numbers, and dispatch dates
The SAC (Sales Approval Certificate) panel tracks finished packing lots from creation through dispatch. Each SAC number links to the cutting batch it came from, so you can trace a shipment back to the exact fabric roll and cutting date.
Role-Based Dashboard Access
Not everyone sees the same dashboard. Access is role-gated:
| Role | Dashboard Access | Key Panels |
|---|---|---|
| Admin / Owner | Full system view | Factory summary, all lots, all payments, all inventory |
| Supervisor | Production + payments + inventory | Live monitor, lot progress, operator list, payment approvals, stock levels |
| Cutting Staff | Cutting room only | Batch creation, QR label printing, fabric receipt, cutting status |
| Operator | Personal only | My earnings today/this month, my quality score, current bundle assignment |
Operators never see other operators' pay. Supervisors cannot modify payment calculations — only approve them. Admins see everything, including the audit log of every scan and every payment entry. This separation matters in factories where wage privacy is culturally sensitive and where disputes often start because operators compared notes.
What the Dashboard Does Not Show (By Design)
A dashboard that shows everything shows nothing. These are deliberately excluded from the main view:
- Historical trend charts — available on drill-down, not the main screen. On a live production dashboard, trend lines distract from what is happening right now.
- Vendor and buyer details — visible in the cutting batch and dispatch panels but not the production monitor. The floor supervisor does not need to know the buyer's margin.
- System configuration — rate tables, machine library, operation templates are in the admin section. The production dashboard is read-only for supervisors.
The design principle is: a supervisor should be able to glance at the dashboard for 10 seconds and know if the factory is on track. If reading the dashboard requires training, it will not get read.
Factory Floor TV Setup
The most visible deployment of the dashboard is the factory floor TV. Our setup:
- 43-inch Android TV at the end of each sewing line, wall-mounted at eye level
- Browser in kiosk mode pointed at the live production monitor URL — no keyboard, no mouse, auto-refresh every 30 seconds
- Local network only — the TV connects to the factory WiFi AP and pulls data from the Raspberry Pi server on the LAN, not the cloud. If internet drops, the TV keeps showing live data from local scans
- Announcement audio — the Pi plays TTS audio announcements through a factory speaker when a bottleneck goes red or a lot hits a milestone
The combination of a visible TV display, audio alerts, and WhatsApp notifications to the supervisor's phone creates three-layer accountability. A bottleneck cannot stay invisible for more than 30 seconds after it forms.
For more on the production TV setup and how it connects to the real-time monitoring system, see the WIP tracking guide. For a broader look at what to evaluate when choosing garment manufacturing software, see the garment factory management system guide.
What to Look For When Evaluating ERP Dashboards
When you are demoing garment ERP systems, here are the questions to ask about the dashboard specifically:
- Does it update in real time, or does someone have to enter data? If a supervisor types in the numbers, the dashboard is a reporting tool, not a monitoring tool. Real-time means data flows from operator scans to the screen without any manual step.
- Does it show WIP by operation, or just total output? Total output is a lagging indicator. WIP by station is a leading one. A dashboard that only shows "Line B: 1,240 pieces today" is not useful at 10 AM.
- Does it work on the factory floor — on a TV, on a phone? If it only runs on a laptop in the manager's office, supervisors walking the floor will not use it.
- Does it work when the internet is down? Any system that becomes blind during a power cut or ISP outage is unreliable for factory use.
- Is the operator dashboard separate and privacy-protecting? Operators should see their own data only. A single shared screen visible to multiple operators creates disputes.
The dashboard is not cosmetic. It is the surface through which all the underlying data — scans, quality scores, attendance, inventory — becomes actionable. A system that collects good data but presents it poorly will not change how the factory is managed. A dashboard that answers the right questions in 10 seconds changes what gets done before 11 AM.
Santosh Rijal is the founder of Scan ERP, a garment manufacturing ERP system designed for factory floor operations in South Asia. He works directly with sewing lines, cutting rooms, and production supervisors across Nepal's garment manufacturing sector.